Immersion doping method of perovskite films
Fabrication of Perovskite Film:SiO2(270 nm-thick) on Si and glasswere used as substrates. The substrates were sequentially sonicated inacetone, 2-propanol, and deionized water for 10 min each. Then, the Si and glass substrates were claned using O2 plasma treatment (200 mT,30 sccm, 50 W) for 120 sec. After dropping 100μL of precursor solution on the prepared substrate, the substrate was rotated at 500 rpm for 5 second then at 4000 rpm for 50 sec with a spin-coater, followed by drying in a nitrogen environment for 5 min and annealing at 100°C for 10 min to fabricate each perovskite filme

Figure. 1 (a) Schematic illustration of immersion doping strategy used in this study. Cracks on wafer represents grain boundaries which allows dopant diffusion into the organic spacer layer.(b),(c) Optical microscopy images (left) and cross-sectional (middle) and top surface(right) SEM images of perovskite films (b) before annealing and (c) after annealing at 100 ℃for 10 min.
Structural Characterization
X-ray Diffraction (XRD): Crystallographic structures of perovskite films were measured by high-resolution X-ray diffraction (HRXRD) technique (Rigaku Smartlab )
Time-of-flight Secondary Ion Mass Spectrometer (TOF-SIMS):Depthpro-file information were obtained using the negative charge ionization po-larity test method as a Cs+, 1 keV, 100 nA etching source in ION-TOF,Germany TOF.SIMS
Nuclear Magnetic Resonance (NMR): NMR measurements were per-formed with a 14.1 T Bruker Avance III spectrometer using a 1.3 mm MagicAngle Spinning (MAS) probe equipped at Seoul National University. Samples were packed into 1.3 mm zirconia rotor in an Ar-filled glovebox andwere spun at 62.5 kHz. Rotor-synchronized1Hand207Pb Hahn echo ex-periments were performed with radiofrequency (rf) pulse amplitudes of200 and 175 kHz, respectively. Conditions for1 H-detected207Pb→1H experiments were optimized with207Pb rf amplitudes fixed to 100 kHz. Shifts were referenced to solid adamantane (1H 1.87 ppm) and solid Pb(NO3)2(207Pb –3474 ppm).
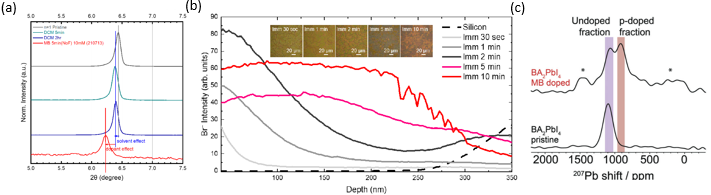
Figure. 2 (a) Powder XRD of pristine n=1 powder (grey), n=1 powder immersed in DCMsolvent (green for 5 min and blue for 2 hours), and n=1 powder immersed in MB dopantsolution (red). (b) Depth profile of Br− intensity under different immersion duration time (Imm).The inset shows optical microscope images of doped films (c) ) 207 Pb Hahn-echo NMR spectra of pristine and MB-doped BA2 PbI4 (n = 1) samples. Each proton and lead environments are color-labeled